You have a table full of numbers in front of you. Everything is correct, but finding the most important information takes far too much time. Only when you present the data in a chart does it become immediately clear which month had the best results and how sales changed.
The same applies to processes. Instead of describing each stage in several paragraphs, you can illustrate it with a simple diagram made of rectangles and arrows.
LibreOffice Writer allows you to create both types of illustrations. You can create charts based on data, edit their appearance, and add diagrams showing relationships between elements.
In this guide, you will learn how to insert a chart in LibreOffice Writer, change its data, choose the appropriate chart type, and create diagrams using drawing tools and LibreOffice Draw.
How to Insert a Chart in LibreOffice Writer
You do not need to open a spreadsheet to create a simple chart.
Writer has built-in tools for presenting data graphically.
To add a chart, follow these steps:
- Open a document in LibreOffice Writer.
- Place the cursor where you want to insert the chart.
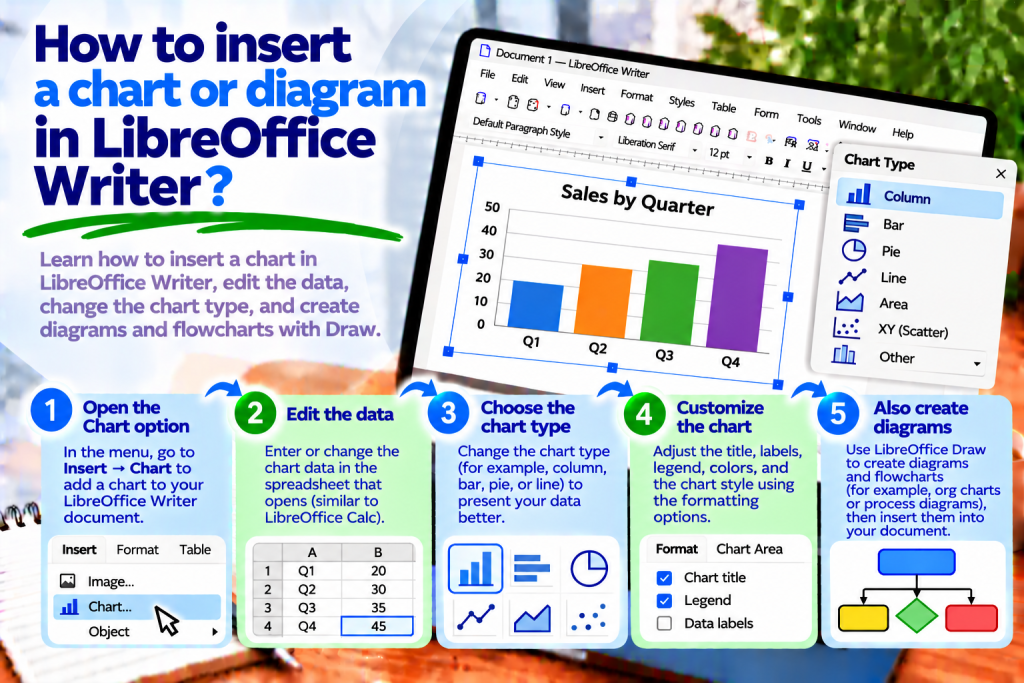
- From the top menu, select Insert → Chart.
- Wait for the program to create a sample chart.
- Use the Chart Wizard if necessary.
- Enter your own data and customize the appearance.
When you finish editing, click outside the chart area.
This will return you to normal document editing.
How to Change Chart Data
After inserting a chart, Writer may display sample values.
Of course, you can replace them with your own information.
First, double-click the chart to enter editing mode.
Then select View → Data Table.
A window containing the values used to create the chart will open.
You can now change the category names and numbers.
When finished, close the data table window.
The chart will adjust to the information you entered.
However, remember that this method applies to charts with their own data table. If a chart uses data directly from a Writer table or a Calc spreadsheet, you must edit the data in the corresponding source.
How to Create a Chart from a Table
Suppose you are preparing a sales report.
You have the following data:
| Month | Sales |
|---|---|
| January | 120 |
| February | 150 |
| March | 180 |
| April | 160 |
Instead of entering the values again, you can use a table already in the document.
First, create a table in Writer and enter the data.
Then click inside the table.
Select Insert → Chart.
The program will open the Chart Wizard and allow you to create a graphical presentation of the values.
This makes it easier to show differences between consecutive months.
How to Choose the Right Chart Type
Not every chart type is suitable for presenting the same information.
Therefore, before choosing one, consider what you want to show.
If you are comparing values across several categories, a column chart is a good option.
However, when analyzing changes over time, a line chart is often more suitable.
A pie chart, on the other hand, can help show the proportion of each category within a whole.
In the Chart Wizard, select the appropriate type and check the preview.
This allows you to determine which option presents the data most effectively.
How to Insert a Column Chart
A column chart is excellent for comparing results.
For example, you can show sales in consecutive months or the number of orders in different departments.
First, insert a chart into the document.
Then select the Column chart type in the wizard.
Enter the appropriate data.
After confirmation, Writer will display the values as vertical columns.
This allows readers to quickly identify the highest and lowest results.
How to Create a Bar Chart
A bar chart is similar to a column chart, but it displays values using horizontal bars.
This is particularly convenient when category names are long.
For example, you can compare the performance of several company departments.
In the Chart Wizard, select the Bar chart type.
Then enter the data and check its arrangement.
The horizontal layout can make labels easier to read.
How to Insert a Line Chart
A line chart helps show how values change over successive periods.
You can use it to display temperatures, website visits, or sales results.
First, add a chart.
Then select the Line chart type.
Enter the values and category names.
Writer will connect the corresponding points with lines.
This makes it easier to identify increases, decreases, and overall trends.
How to Create a Pie Chart
A pie chart is useful when you want to show the proportion of individual elements within a whole.
For example, you can present how expenses are divided among several categories.
Insert a chart and select the Pie chart type.
Then enter the values.
The program will divide the circle into corresponding sections.
However, remember that a pie chart works best with a small number of categories.
If you have a dozen or so similar values, comparisons may become difficult.
In that situation, consider using a bar chart instead.
How to Change the Type of an Existing Chart
You do not need to delete a chart and create it from scratch.
If you decide that a different type would be easier to read after entering the data, you can change it.
Double-click the chart.
Then select the chart type command available in the Format menu.
Choose the new type and confirm the settings.
This allows you to keep the data while changing how it is presented.
How to Add a Chart Title
A title should clearly explain what the data represents.
Instead of entering a general label such as “Results,” it is better to use:
Product Sales in the First Four Months
To add a title, double-click the chart.
Then select Insert → Titles.
Enter the appropriate title.
After confirmation, the title will appear on the chart.
This helps readers understand the information more quickly.
How to Add Chart Axis Titles
A chart may contain a horizontal and a vertical axis.
Therefore, it is worth clearly indicating what the values represent.
For example, you can display months on the horizontal axis.
The vertical axis can show the number of products sold.
To add descriptions, enter chart editing mode and open Insert → Titles.
Then complete the appropriate axis title fields.
This makes the chart understandable even without additional explanation.
How to Change Chart Colors
Colors help distinguish data series.
However, too many intense colors can make analysis difficult.
Therefore, it is best to use a simple and consistent color scheme.
Double-click the chart, then select the data series you want to change.
Open its formatting settings.
Choose the appropriate color or fill style.
This allows you to match the chart to the overall appearance of the document.
How to Change the Chart Legend
A legend explains what the different colors and data series represent.
For example, you may be comparing sales of two products.
In this case, the legend helps identify which series represents the first product and which represents the second.
To customize the legend, enter chart editing mode.
Then select the appropriate legend settings.
You can change its position or hide it if it is unnecessary.
This makes the chart clearer.
How to Add Data Labels
Sometimes the height of a column alone is not enough.
If you want to show exact values, you can add data labels.
First, enter chart editing mode.
Then select the appropriate series and use the command to insert data labels.
Writer can display the values directly next to the chart elements.
This means readers do not have to estimate every number from the axis.
How to Resize a Chart
After inserting a chart, it may take up too much space.
In this case, click it to select the entire object.
Then drag the appropriate handle.
You can also use the size settings if you need exact dimensions.
However, be careful not to make the chart too small.
Very small labels and values may become unreadable.
Therefore, check all text after resizing.
How to Move a Chart to Another Position in the Document
A chart is an object placed within a document.
Therefore, its position depends on its anchoring and arrangement settings.
First, click the chart to select the entire object.
Then try moving it with the mouse.
If you cannot achieve the desired result, check the anchoring settings.
This makes it easier to place the chart next to a specific paragraph or between sections of text.
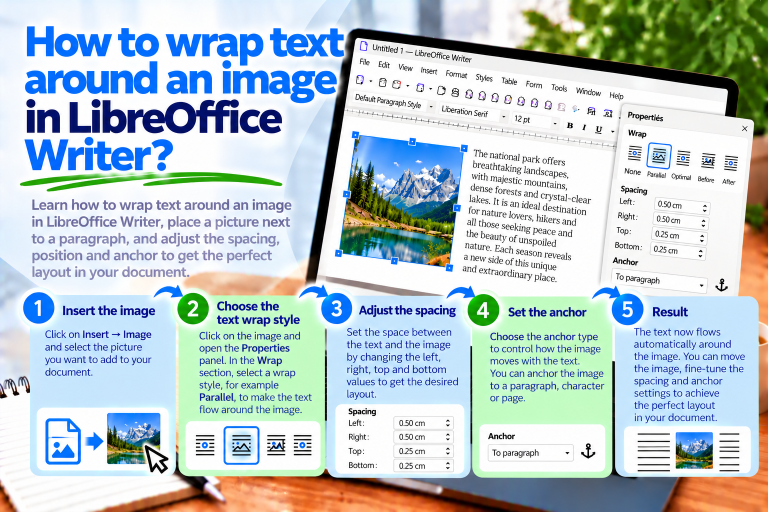
How to Wrap Text Around a Chart
A chart does not always have to occupy the entire page width.
Sometimes you may want to place it next to a short description.
In this case, check the text wrapping settings.
First, select the entire chart object.
Then open the available anchoring and wrapping options.
Choose the method that matches your intended layout.
However, remember that charts often contain many small elements.
Therefore, larger charts should have enough space to remain readable.
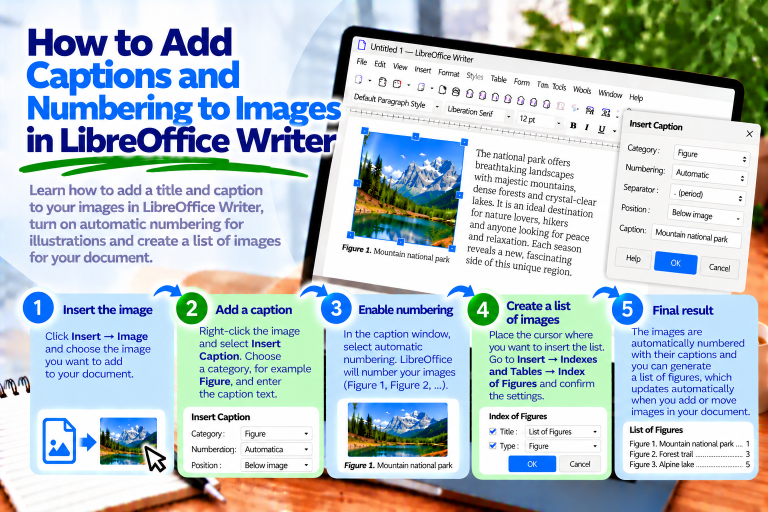
How to Add a Caption Below a Chart
In reports and academic papers, it is worth numbering charts.
For example, you can use the caption:
Chart 1: Product Sales by Month
To add it, select the chart object.
Then use Insert Caption, if it is available for the selected object.
Choose a category or create your own category named “Chart.”
After confirmation, Writer will add the caption.
This allows you to maintain consistent numbering for all charts.
How to Create a Chart in LibreOffice Calc
If you are working with a larger amount of data, it may be more convenient to prepare the chart in Calc.
First, open a spreadsheet.
Then enter the data into the cells.
Select the appropriate range.
Choose Insert → Chart.
The program will launch the Chart Wizard, where you can choose the chart type and customize the data series.
When finished, you will have a chart based on the spreadsheet values.
How to Transfer a Chart from Calc to Writer
After creating a chart in Calc, you can place it in a text document.
First, select the chart in the spreadsheet.
Then copy it using:
Ctrl + C
Switch to Writer and place the cursor in the appropriate location.
Use:
Ctrl + V
The chart will appear in the document.
However, remember that a regular copy of a chart may not update automatically when the data in the original spreadsheet changes.
Therefore, after every significant data change, check whether the chart in the document shows the current values.
Does a Chart Update Automatically?
This depends on how it was created.
If a chart uses data directly from a Writer table, changes to the source data may update its appearance.
A chart based on Calc spreadsheet data works similarly.
However, a copied chart may be an independent copy.
In this case, later changes to the data in the original spreadsheet may not affect the chart in Writer.
Therefore, it is important to distinguish between a chart linked to its data source and a copied object.
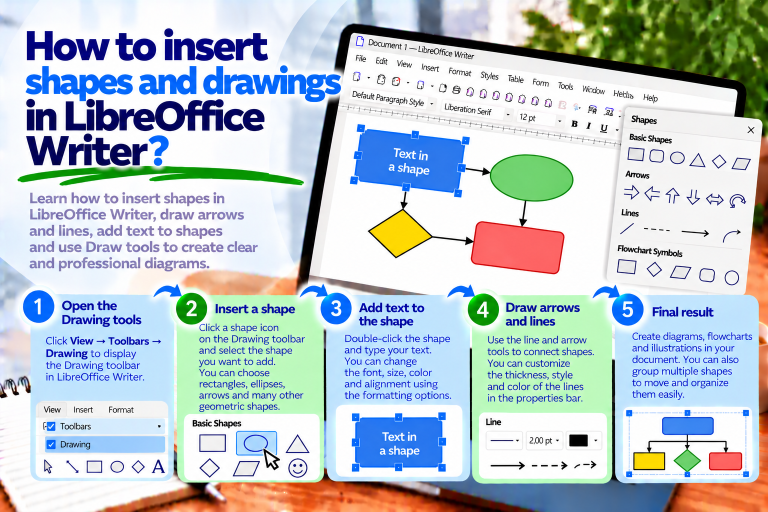
How to Insert a Diagram in LibreOffice Writer
A chart primarily presents numerical data.
A diagram, on the other hand, can show a process, structure, or relationships between elements.
For example, you can create a diagram illustrating order processing.
To create one, enable the Drawing toolbar.
Select View → Toolbars → Drawing.
Then add rectangles, arrows, and any other necessary shapes.
This allows you to create a simple diagram without leaving Writer.
How to Create a Simple Diagram with Rectangles
Suppose you want to show three stages of document preparation.
First, draw three rectangles.
Then enter the following text inside them:
Content Preparation
Document Formatting
Saving the File
Connect the shapes with arrows.
Finally, align the elements and set similar spacing.
This will give you a simple diagram showing the sequence of actions.
How to Add Arrows to a Diagram
Arrows indicate the direction of information flow.
Therefore, they are among the most important elements of flowcharts.
On the Drawing toolbar, select the appropriate arrow or connector tool.
Then connect the selected shapes.
If you use connectors, you can attach them to the objects’ connection points.
This makes moving the shapes more convenient.
How to Add Text to Diagram Elements
Each stage of a diagram should have a short, understandable description.
First, select the appropriate shape.
Then start editing its text, for example by double-clicking the object.
Enter the stage name.
When finished, adjust the alignment and font size.
This makes the diagram readable without requiring lengthy explanations.
How to Align Diagram Elements
Unevenly positioned shapes can make a diagram difficult to understand.
Therefore, it is worth using alignment features.
First, select several objects.
Then choose the appropriate alignment command.
You can align the shapes along a common edge or axis.
It is also worth maintaining similar spacing between elements.
This will make the diagram look more professional.
How to Group Diagram Elements
If a diagram consists of many shapes, moving each one individually can be inconvenient.
Therefore, it is worth combining them into a group.
First, select all the diagram elements.
Then choose Group.
After grouping, you can move the entire diagram as a single object.
This makes it easier to maintain the relative positions of rectangles and arrows.
How to Create a Diagram in LibreOffice Draw
For more complex diagrams, it is worth using LibreOffice Draw.
This is a separate module of the suite designed for creating drawings and diagrams.
To launch it, select:
File → New → Drawing
Then add the appropriate shapes.
You can create flowcharts, organizational charts, and illustrations showing processes.
When finished, you can transfer the project to Writer.
How to Transfer a Diagram from Draw to Writer
First, prepare the diagram in LibreOffice Draw.
Then select the required objects.
Copy them using:
Ctrl + C
Switch to the Writer document and use:
Ctrl + V
Depending on how you paste the objects, you may retain the ability to edit individual elements.
If you need a stable layout, also consider exporting the diagram as an image file.
How to Save a Diagram as an Image
In Draw, you can export a completed project to a file.
First, prepare the diagram.
Then select File → Export.
Choose the appropriate format, such as PNG or SVG.
After saving, open Writer.
Select Insert → Image and choose the exported file.
This allows you to place the completed diagram in the document.
Is It Better to Use PNG or SVG?
For simple diagrams made of shapes and lines, SVG is often worth choosing.
It is a vector format that works well when scaling.
PNG, on the other hand, can be a convenient choice for graphics containing screenshots.
However, remember that after inserting a PNG image, you will not be able to edit individual shapes in the same way as in the original Draw project.
Therefore, it is best to keep the source file as well.
How to Add an Organizational Chart
An organizational chart shows relationships between positions or departments.
For example, you can illustrate a company’s structure.
First, draw a rectangle containing the name of the main position.
Then add more boxes for the departments reporting to it.
Connect them with the appropriate lines.
Finally, align the elements.
This will give you a clear organizational structure.
If the chart contains many levels, it will be more convenient to create it in Draw.
How to Create a Flowchart
A flowchart illustrates the successive stages of a process.
First, identify the beginning and end.
Then add rectangles describing the actions being performed.
If the process includes a decision, you can use a diamond shape.
Connect the elements with arrows indicating the direction of the process.
This helps readers understand the order in which operations are performed.
What Is the Difference Between a Chart and a Diagram?
Although both are graphical ways of presenting information, they serve different purposes.
A chart is primarily used to present numerical data.
It can show comparisons, changes over time, or percentage shares.
A diagram, on the other hand, is used to illustrate relationships, structures, and processes.
Therefore, before starting, it is worth determining what type of information you want to present.
Why Doesn’t a Chart Display the Correct Data?
First, check the source values.
Then make sure the correct data range is selected.
It is also worth checking whether category names have been treated as ordinary numerical values.
If the chart comes from a Writer table, correct the data directly in that table.
However, if the chart has its own data table, open the appropriate editing window.
This makes it easier to identify the cause of the problem.
Why Can’t I Edit Chart Data?
Not every chart uses the same data source.
If a chart is linked to a Writer table or a Calc spreadsheet, the internal data table window may be unavailable.
In this case, you must change the values in the source table or spreadsheet.
However, if the chart was created using default data, you can edit its own data table.
Therefore, before making changes, check how the chart was created.
Why Does a Chart Move While Typing?
The problem is usually caused by the object’s anchoring.
If a chart is associated with a paragraph, changes in the document may affect its position.
Therefore, check the anchoring and arrangement settings.
It is also worth maintaining appropriate spacing between the chart and the text.
This will make the document layout more predictable.
Why Is a Chart Blurry After Saving to PDF?
First, check the chart size.
If it contains very small text, it may become difficult to read after being reduced.
Then check the PDF export settings.
It is also worth making sure that the chart has not previously been converted into an image with insufficient resolution.
This will help you avoid readability problems.
How to Prepare a Chart for a Report
First and foremost, choose the appropriate chart type.
Then add a clear title and axis labels.
If you are presenting several data series, make sure the legend is easy to read.
It is also worth limiting unnecessary decorative elements.
Finally, check that all values are correct.
This will make the chart not only attractive but, above all, useful.
How to Prepare a Diagram for Instructions
First, identify the most important stages of the process.
Then choose simple shapes.
It is worth using short descriptions and consistent colors.
Arrows should clearly indicate the direction of the process.
Also, maintain similar spacing between elements.
This makes the diagram understandable even to someone learning about the process for the first time.
Most Common Mistakes When Creating Charts and Diagrams
The first mistake is choosing the wrong chart type.
For example, a pie chart is not always suitable for comparing many categories.
Another problem is the absence of axis labels and a title.
It is also best to avoid using too many colors.
In diagrams, common mistakes include using too many shapes and making the direction of arrows unclear.
Therefore, before finishing, it is worth looking at the illustration from the reader’s perspective.
Can its meaning be understood quickly?
If not, simplify the layout.
What Is the Fastest Way to Insert a Chart or Diagram?
If you want to present numerical data, open Writer and select Insert → Chart.
Then choose the chart type and enter the appropriate values.
However, if you need a diagram, enable the Drawing toolbar.
Add shapes, enter descriptions, and connect the elements with arrows.
For more complex projects, use LibreOffice Draw.
This allows you to choose the right tool for the type of illustration you are creating.
Inserting charts and diagrams in LibreOffice Writer allows you to present information more clearly.
Charts work best for numerical data. You can create column, bar, line, and pie charts, then customize their titles, colors, and labels.
Diagrams, on the other hand, help explain processes, structures, and relationships between elements.
For simple diagrams, Writer’s drawing tools are sufficient. More complex projects are easier to create in LibreOffice Draw.
If you are working with a large amount of data, it is also worth using LibreOffice Calc.
The most important thing is to choose the appropriate way to present information. A well-designed chart or diagram should make the document easier to understand and help readers find the most important data more quickly.